
Home / The Work / Dandyland Custom Tattoo
Case study · Local service · 30 days
Dormant to
ringing phones
in 30 days.
Dandyland had 28,000 followers who had effectively stopped seeing the work. The opportunity was never to chase new followers — it was to wake up the ones already there and turn attention into booked chairs.
Phone calls placed from paid, Meta-tracked
Link clicks through to the booking page
Facebook content views per day
Instagram reach per day
Where they started
A big list.
Very little reach.
Roughly 16.8K followers on Instagram and 11.6K on Facebook — a genuinely sizable local audience for a tattoo studio. But posting was inconsistent, there was no artist-spotlight system, no TikTok presence at all, and Facebook had gone quiet entirely.
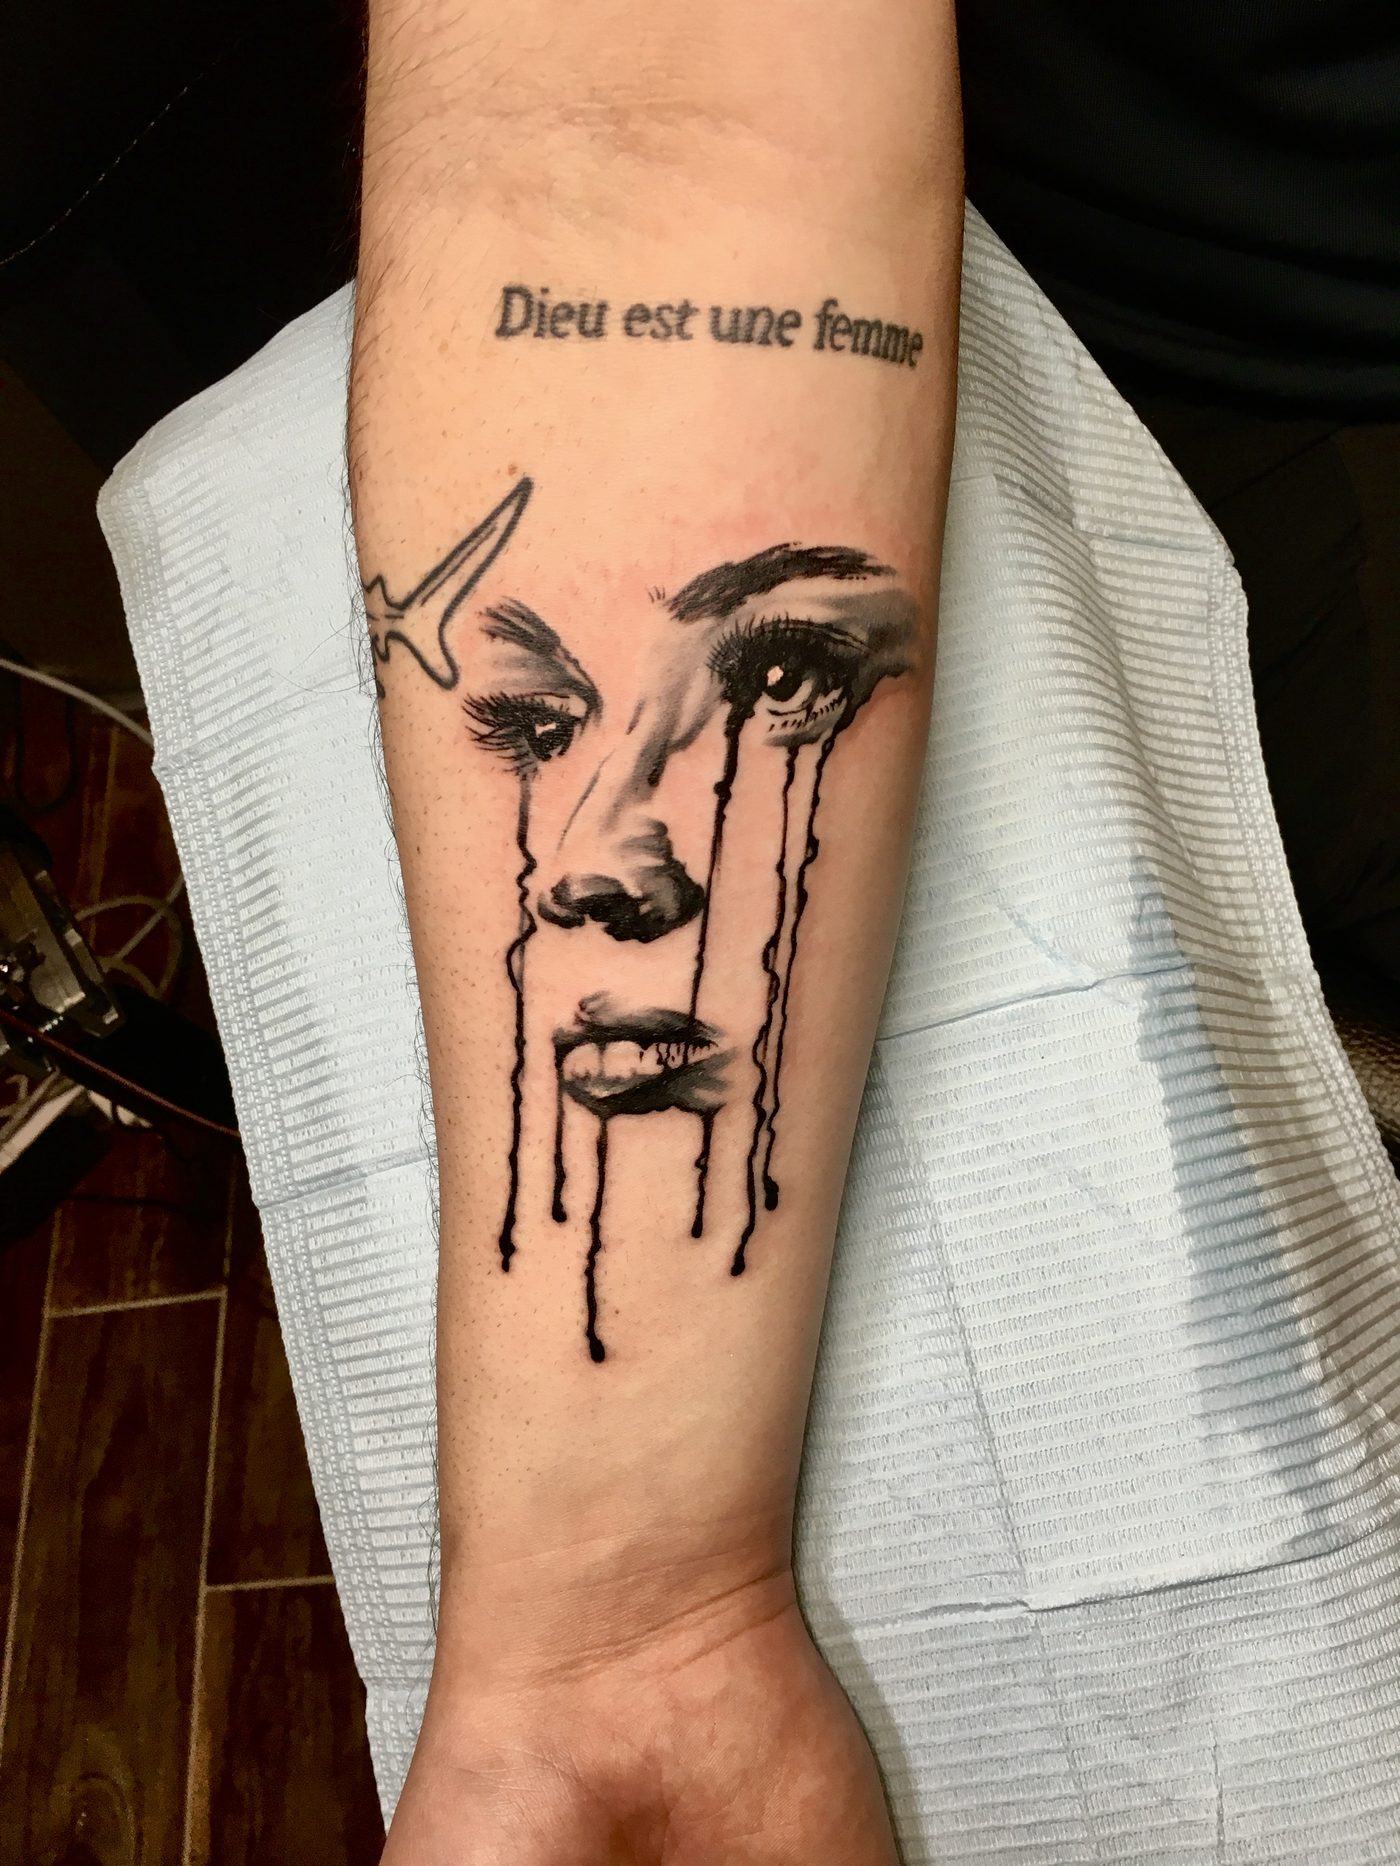
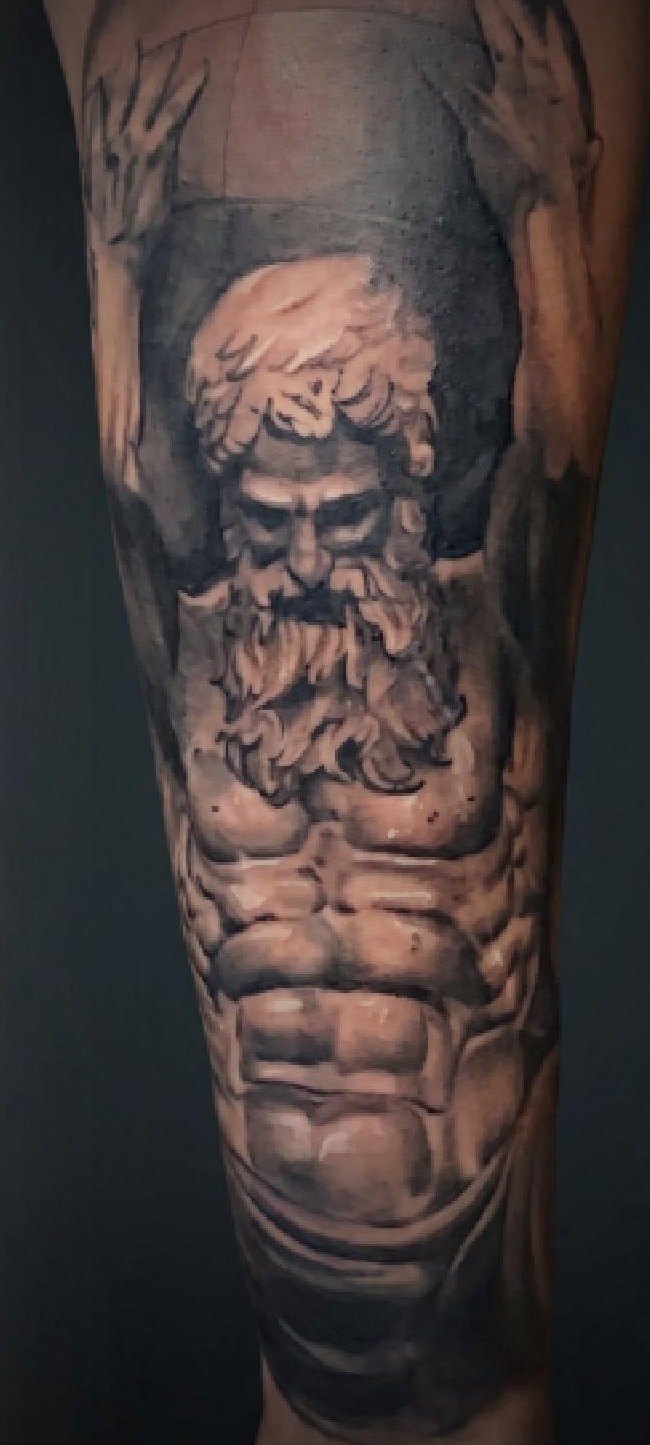
Meanwhile the studio's actual product — the work coming off the artists' machines — is exceptional and almost entirely unseen.
What we changed
Cadence, coverage,
and a phone number.
Doubled the cadence
From ~0.9 posts a day to ~1.5 a day, split across Facebook, Instagram and TikTok at each platform's own best-time slot.
Artist-spotlight rotation
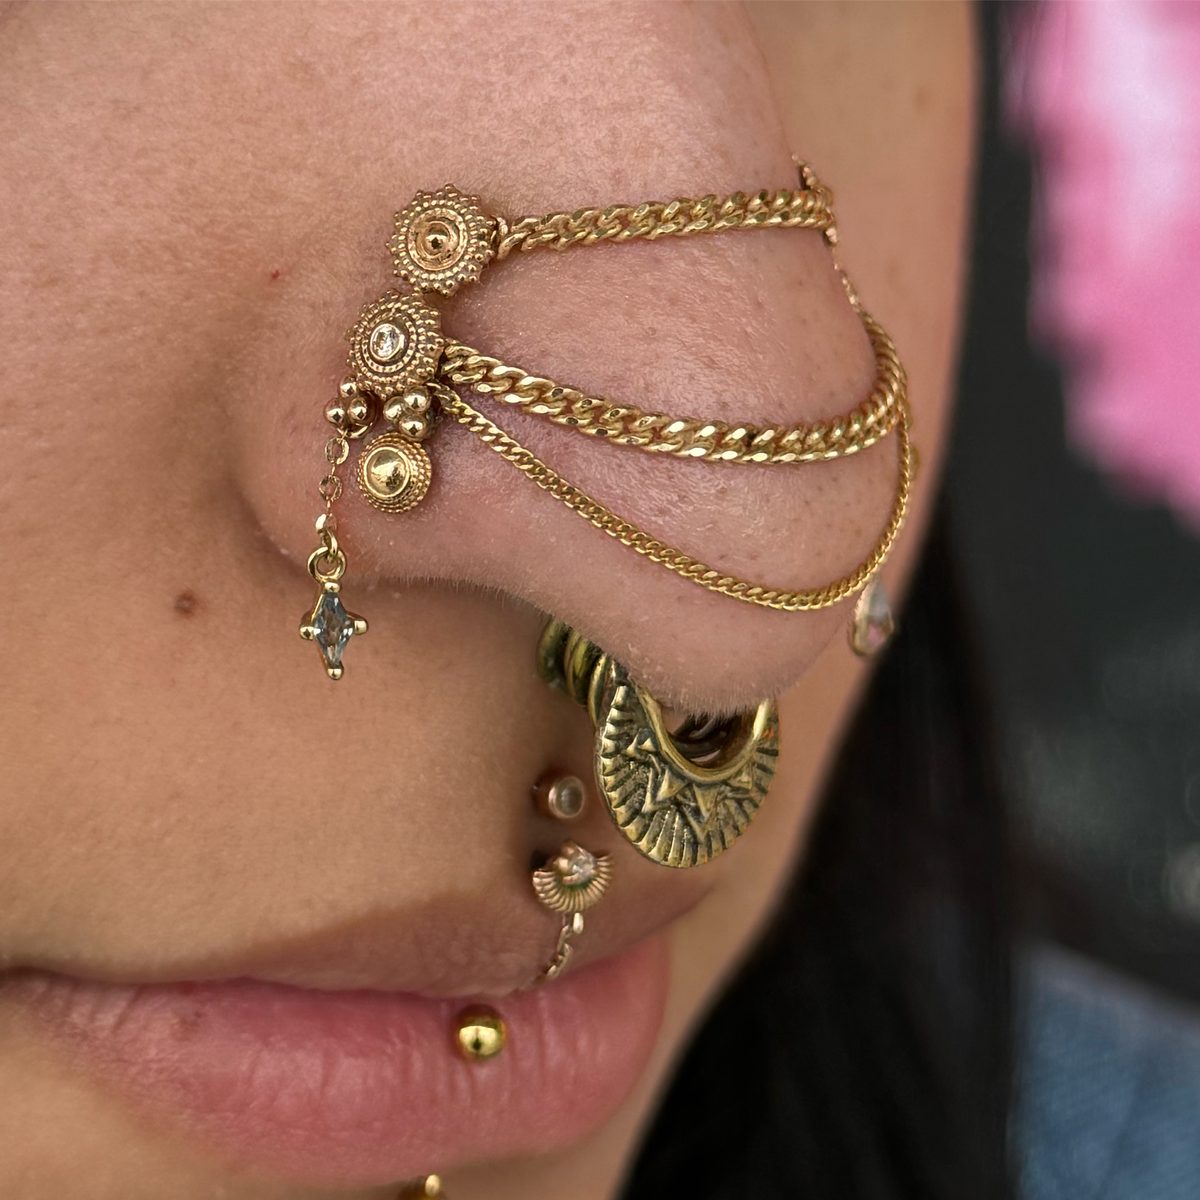
Josh, Cheese, Miro and Frankie each get even airtime — and so does the piercing side of the business.
Four content pillars
The Chair, Meet the Artists, Meaningful Ink, and Before & After. The last one shipped immediately from delivered footage.
Launched TikTok from zero
A channel that didn't exist, live and active inside the window.
Reactivated Facebook
Dormant page brought back with Reels — the single biggest percentage mover in the whole engagement.
Always-on call campaign
A click-to-call campaign pointed straight at the front desk. Not brand awareness. Phone calls.
The organic lift
Same audience.
Seeing far more.
Baseline is early July, pre-ramp. “Now” is the last two weeks of the window. Daily averages, so the comparison holds even across different day counts.
| Metric | Baseline | Now | Change |
|---|---|---|---|
| Instagram reach / day | ~270 | ~1,050 | +290% (3.9×) |
| Instagram views / day | ~1,700 | ~3,700 | +120% (2.2×) |
| Audience engaged / day (IG) | ~44 | ~62 | +41% |
| Facebook content views / day | ~590 | ~3,900 | +560% (6.6×) |
| Posting cadence | ~0.9/day | ~1.5/day ×3 | ~2× + multi-platform |
| TikTok channel | None | Live | New channel |
Follower count stayed roughly flat — on purpose. This was never a vanity-follower play. The win is reactivation: the same people now see the work several times more often.
The paid engine
Built to make
the phone ring.
| Metric | July campaign | August (newly launched) |
|---|---|---|
| Impressions | 43,934 | 3,345 |
| People reached | 14,748 | 2,013 |
| Clicks (CTR) | 969 (2.21%) | 69 (2.06%) |
| Link clicks to booking | 386 | 33 |
| Phone calls placed | 38 | 5 |
| Cost per call | Baseline | Less than half of July |
Across both campaigns: 43 phone calls placed and roughly 419 link clicks through to booking. The August campaign is driving calls at less than half July's cost as it optimizes — the system gets more efficient the longer it runs.
What we can't claim
The honest
caveat.
We can prove the ads placed 38 calls, because Meta tracked them. We cannot prove which of those calls became a booked appointment, because the studio isn't running call tracking. There is no confirmed line from ad to till, and we won't draw one.
That gap is also the single biggest lever on the real number. Turning on call tracking and tightening front-desk capture is the first recommendation in the follow-up plan — so next month's figure is measured rather than estimated.
Plenty of agencies would put a modeled revenue multiple on this page. We'd rather you trust the numbers that are on it.
Start here
Phone not ringing enough?
If you run a local business with a front desk, this is the exact play. Fifteen minutes and I'll tell you what it would cost to point one at you.
Rather skip the form? contact@asparkcreative.com